Smart Drones
Agriculture
GSD FIELD
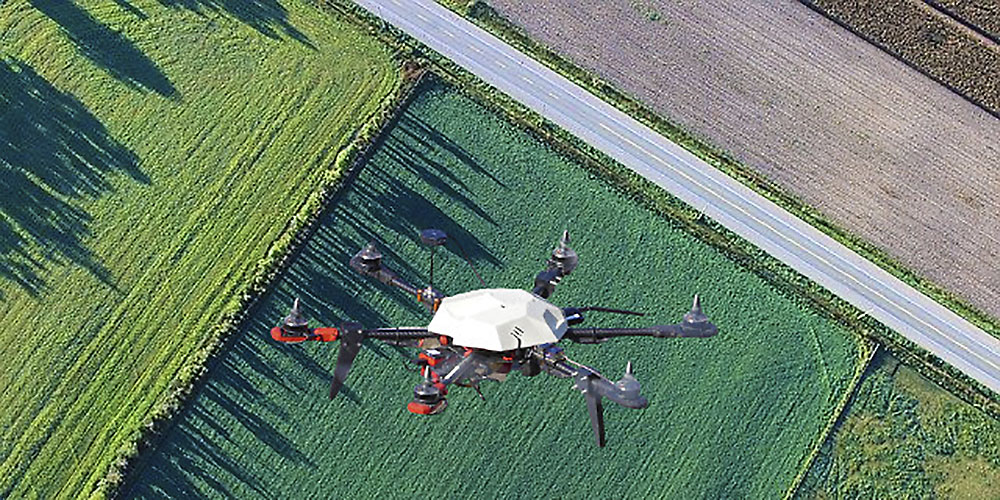
GSD FIELD is the asset of GlobsitSmartDrones dedicated to agriculture for the acquisition of advanced multispectral data. The surveys are carried out using a high-performance drone designed for long-range scenarios, controlled by an on-board AI that guarantees the quality and reliability of the data collected, as well as the safety of unmanned flights.
All measurements made during the flight are analyzed by a neural network capable of generating an accurate report, classifying all the anomalies found and providing accurate operational indications.
8 different standard indices allow you to explore the state of the crop. Differential processing of the data collected by the on-board sensors identifies, in this case, the areas subjected to stress for variable reasons, correlating the measurements to the type of index in question.
Below is an analysis of the calculated indices that can be customized upon specific customer request to adapt the analysis to the vertical needs of the crop analyzed.
GNDVI – Index of the photosynthetic activity of the plant, it allows to determine the absorption of water and nitrogen in crops. This data is indicative for the level of irrigation as it allows to quickly identify the isolation of water in the field.
NDVI – Index of the fraction of photosynthetically active radiation absorbed by the plant. A low value (0.3 – 0.5) corresponds to a low vigor area while a high value (0.7 – 1) corresponds to a high vigor area. This value is effective in the planning phase of foliar and post-harvest fertilization.
MCARI – Very sensitive index that provides a measure of the depth of absorption of chlorophyll that is not affected by lighting conditions or by ground reflectance or other photosynthetic materials. The information deduced from the analysis of this index allows to plan accurately the fertilization, maximizing the yield.
NDR/NDRE – Threshold indices of chlorophyll dispersion caused by the internal structure of the leaf. Understanding the levels of chlorophyll allows you to monitor photosynthetic activity and optimize collection times. In viticulture, for example, reaching the maximum sugar content in grapes involves a significant change in the values of this index. This same index also makes it possible to determine when an outbreak of insect infestation is serious, to accurately plan the use of pesticides and pesticides, reducing costs and improving the quality of the final product.
SIPI2 – Index that measures the degradation of crops. It allows to identify very quickly the areas infested by parasites also evaluating the severity of the problem. The information obtained from an analysis of the SIPI2 allows perfect planning of the use of pesticides so as to intervene with precision only in the areas that need treatment.
TGI – One of the best indexes for quickly detecting the nitrogen needs of crops. A map generated on a regular basis by the TGI index allows for nitrogen fertilization planning to minimize crop stress.
GSD Field has also developed analysis support models:
The Irrigation Model of GSD FIELD permits to have a detailed map of the variability of irrigation in the crop, immediately identifying the areas that require maintenance of the irrigation system. This model also makes it possible to detect areas with over-irrigation for particular characteristics.
The Status Model translates the information of the calculated indices into an operational report, based on the specifications of the crop analyzed and on the type of anomalies found. In this map the stressed and / or degraded areas will be visible, thus allowing a quick identification of the areas where it is necessary to intervene.
The Operation Model is a summary of the information relating to the treatments to be carried out in the field. The map can present specific annotations and operational indications generated by the AI system for easier planning of interventions.
Finally, the Ortomosaicatura of the multispectral photogrammetric survey of the analyzed crop allows a simplified digital navigation of the crop. With GSD FIELD, it will be possible to view the georeferenced maps of the area, navigating them as it usually happens with a satellite / aerial map at various zoom levels. This map is a valuable resource for anyone monitoring large, distributed crops
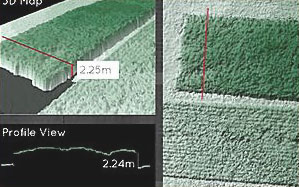
Thanks to GlobsitSmartDrone aerial photogrammetry, 3D models are obtained that allow to verify the growth of the plant. The on-board laser measurement technology allows the sizing of the plant which is subjected to monitoring of its entire state of growth. Laser sensors (Lidar) mounted on drone allow to obtain continuous large-scale estimates of the dendrometric variables of main interest, such as wood volume and wood biomass, minimizing the need to collect measurements in the field. At the same time, the reconstruction of 3D models is aimed, for example, at evaluating the inclinations of the land, for an analysis of the areas of water stagnation.
Finally, The GSD FIELD report will therefore contain both the classifications generated by the AI and a series of maps that will remain available to the customer for any further inspections, evaluations and comparisons. In this solution, by planning a mapping at regular intervals (ideally every six months) it will also be possible to evaluate the effectiveness of the interventions and monitor the development of the anomalies found.
The GSD FIELD Inspection report was designed to help the client increase productivity while lowering operating costs. At the end of the processing the neural network will generate different mappings a report with accurate operational indications,thanks to Globsit hardware, with technologies machine learning on-board and the application of advanced statistical systems.
CERTIFICATIONS